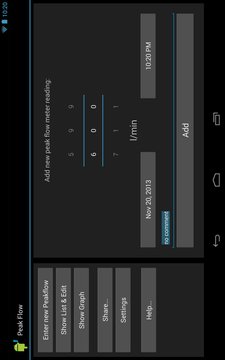
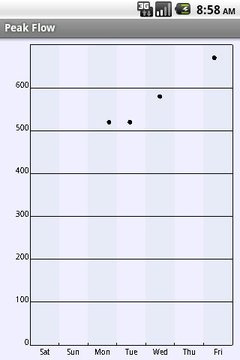
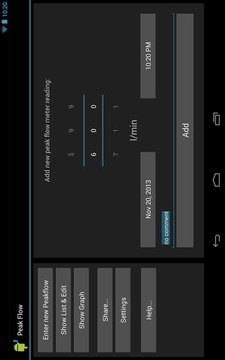
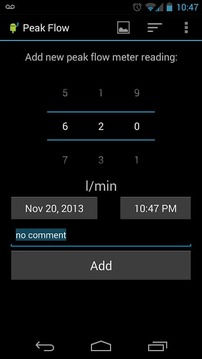
Use to monitor your asthma by logging your peak flow readings on your phone or tablet. Add a new peak flow reading upon start, and then look at a history graph.
Your peak flow values can be displayed on the phone at any time, and you can even scroll throughout your history graph. Also, send your last month' history graph by email, or export your entire history to a text file on the SD card so you can discuss the state of your asthma with your health care provider. And yes, you can read in that text file if you get a new phone!
This app is meant to do one simple task without any distraction. I will try to implement requests if they appear feasible. Distributed as-is!
使用它来监视你的哮喘,记录您的手机或平板电脑上的洪峰流量读数。添加一个新的高峰流量读数时开始,然后看看在历史图。
你的峰流速值可以在任何时间,在手机上显示,你甚至可以滚动整个历史图。此外,通过电子邮件发送上个月的历史曲线图,或导出到一个文本文件在SD卡上,这样你就可以与您的健康护理提供者讨论你的哮喘状态,你的整个历史。是的,你可以读取该文本文件中,如果你得到一个新的手机!
这个程序是为了做一个简单的任务,没有任何分心。我会尽力来实现请求,如果他们出现可行的。分布式是!
流量监控更新内容
-Select in preferences if graph should snap to full week / month / year or
not. Default behaviour is yes, it is was before.
网友评论更多